
Effective leadership in the new world needs new skills – the number one skill is leading with data. Through helping large department heads in a range of companies I have discovered several ways of delivering leadership through data.
3 Step Method for Targets
I will show you a simple 3 step method of creating a target for any team to hit and then how to automate it so your team keeps hitting their targets.
Learnings from a Grocery Company
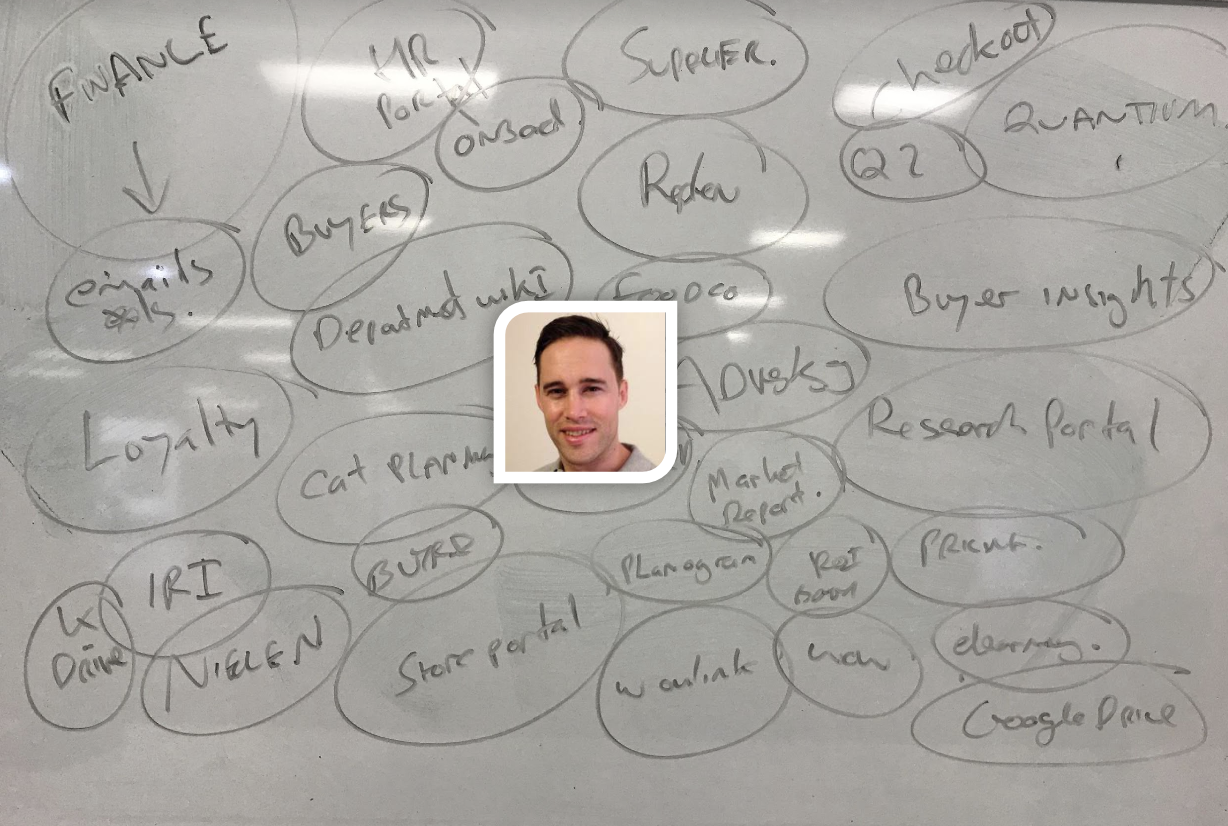
This came from working with a large grocery company, I mapped the following lists of all the data they were working with. It was 30 systems and each system had up to 240 tables they were meant to be monitoring to get across supply, sales, rois, customer insights, and many other areas of the business they were managing.
The problem with this is with meetings and producing reports and managing the people under him, he wasn’t logging in to all the systems and he wasn’t monitoring what his KPIs were.
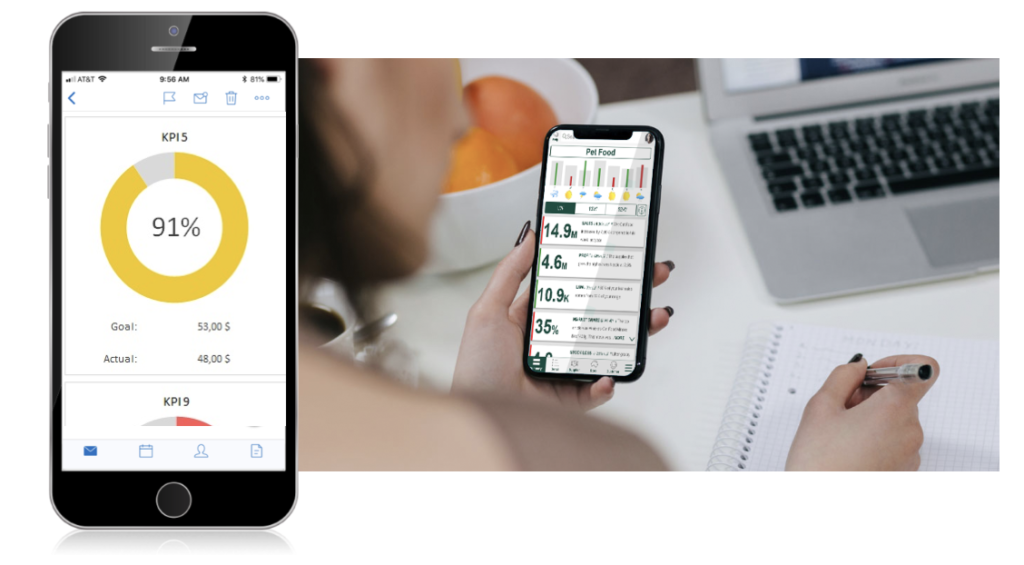
I delivered a system for him that allowed him to monitor all his KPIS on mobile and get email updates customised for him and his team. A simple system of management to automatically deliver KPIS.
This utopia seems unattainable and always has been at each company I have delivered for but I always deliver the same three steps.
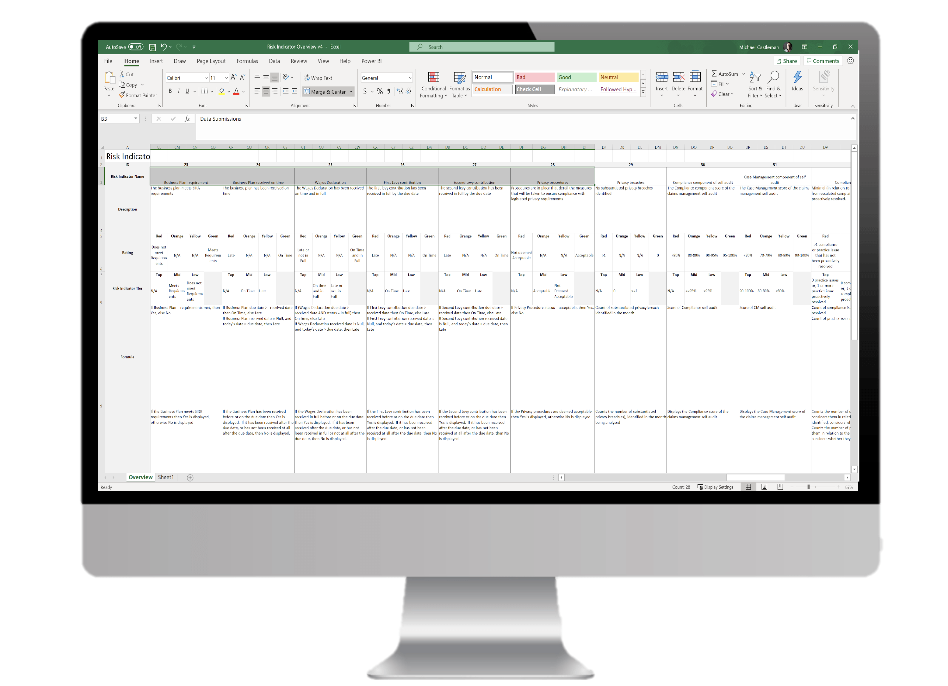
Step One – Map KPIs
Step one map out each of your initial KPIs you measure and create a threshold for what is red, green, and yellow. It clearly marks what you think is an acceptable level for anything, I suggest even putting in things like customer satisfaction and employee satisfaction and use soft numbers like NPS or a simple survey for employee happiness. It is important to keep in mind you will improve. With one insurance company, I started with 20 metrics and within 8 weeks there were 114. The key is to check the data sources and put your metrics in quickly. Causal mapping is a great technique for this, start with what you want to achieve and then map that back to what will cause that. For example, if you want sales, you need proposals, which need meetings, which need calls.
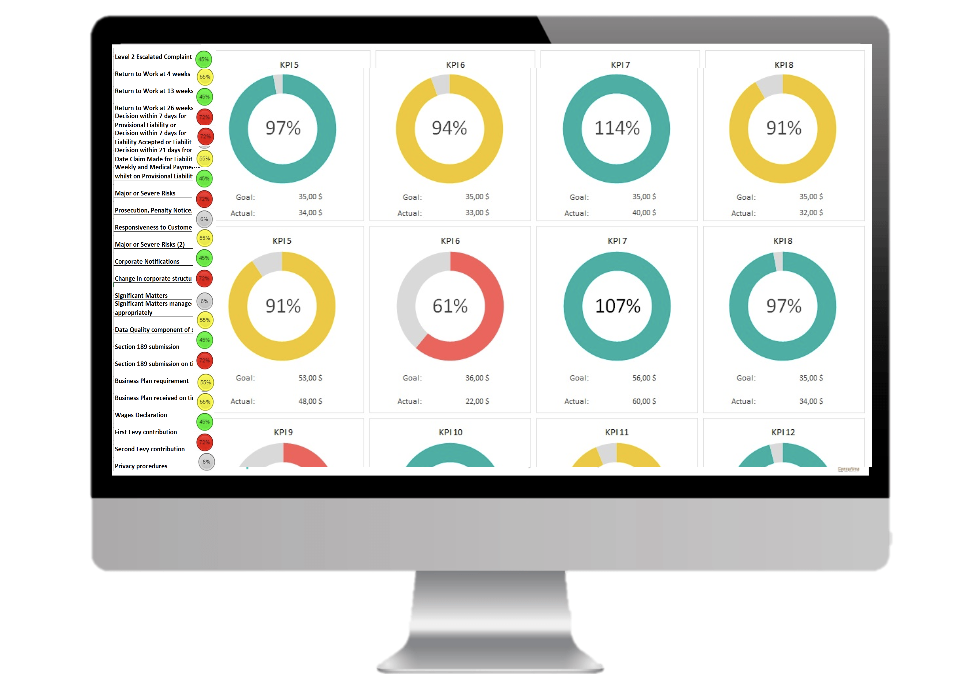
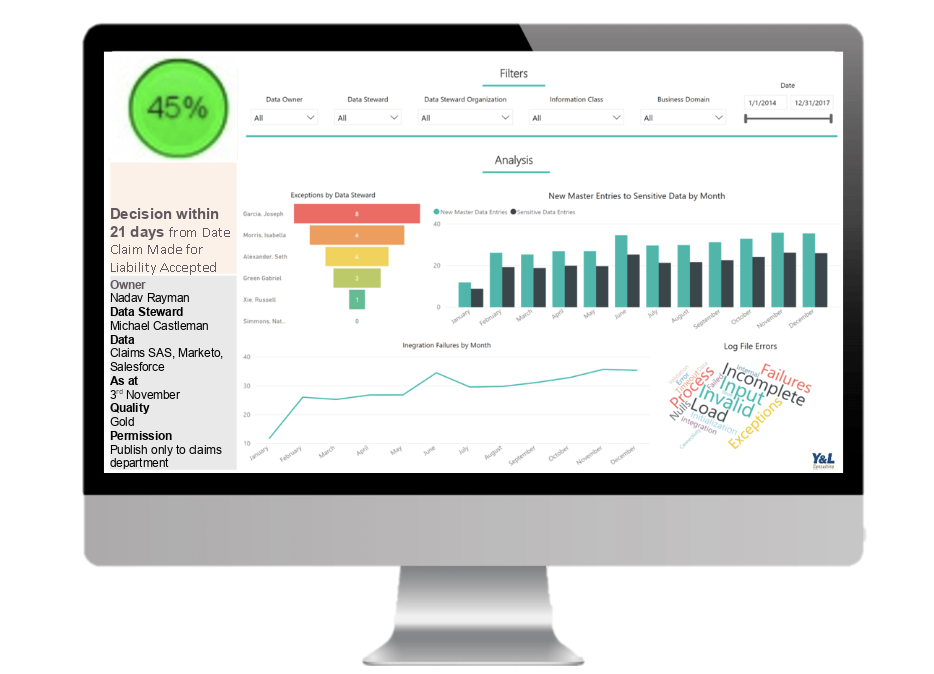
Step Two – Create a Dashboard
Then run that into a dashboard, with each of the metrics. From here you can then create drill-downs that allow each metric to be investigated:
Step Three – Setup Emails
Now you build out the experience by setting up emails of the main dashboard with clickable links:

And ideally you make a searchable main home page or portal.

From here you can start to make a list of all the employees and which metrics they see and receive.
The Result is Metrics to Manage
You then have the metrics about your team you want to measure, they are being emailed daily/weekly/monthly. From here you put in the meetings to check the numbers and a facility for escalating immediate issues. For example, if you have a situation where a red can cause a problem you can create a trigger for an action committee to be brought together around an emergency to start moving to real-time response to problems.
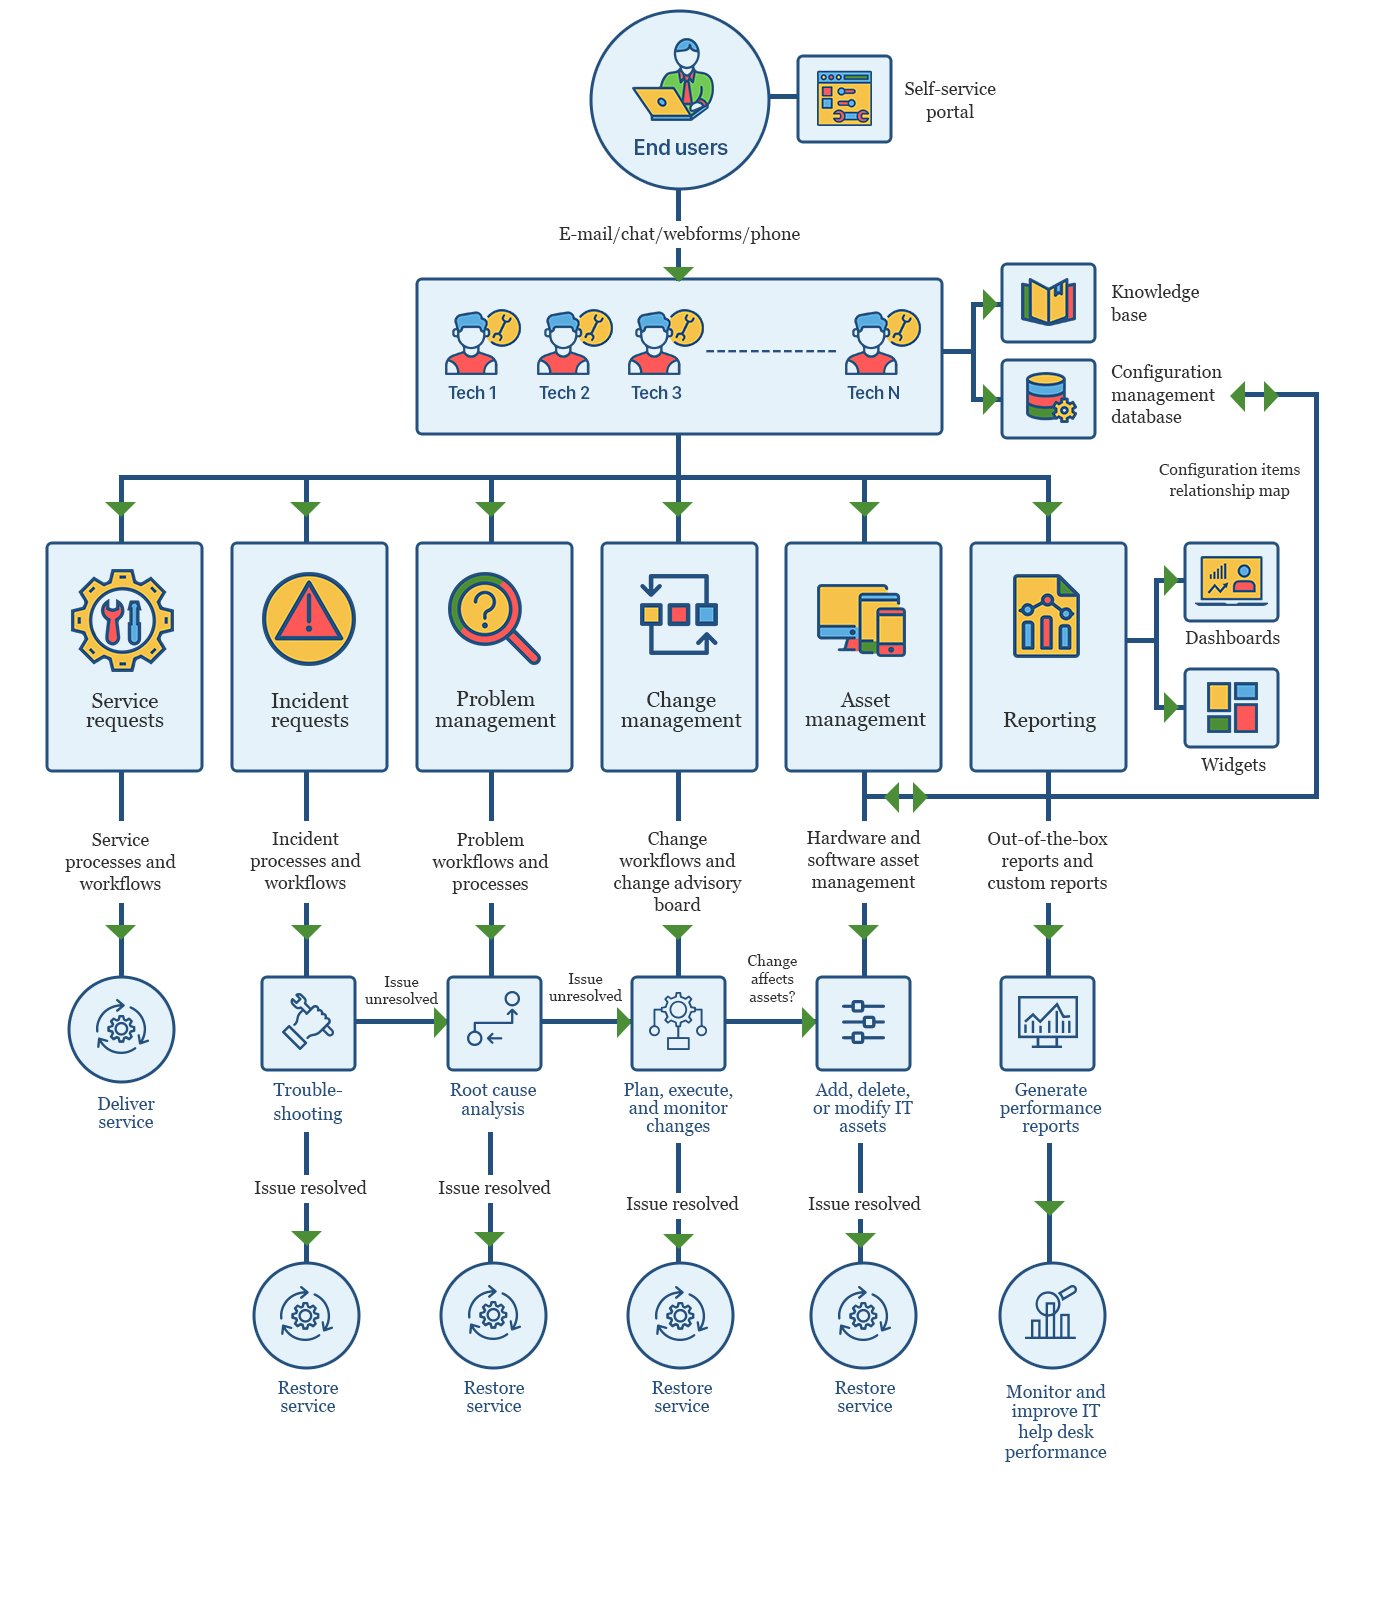
Workflow Management
Once this is in place I suggest you move to workflow management to respond to these KPIs and data points.
You need to apply basic dataops principles to this, build it quick and simple first in excel, and improve with iterations.
Blueprint
If you need a blueprint please reach out and we can run you through the frameworks for how to make this work. Please email us at mc@trackita.com.